Anika Halota, NASA, HDF Group Guest Blogger
| Editor’s Note: Since this post was written in 2017, The HDF Group has developed the Highly Scalable Data Service (HSDS) which addresses the challenges of adapting large scale array-based computing to the cloud and object storage while intelligently handling the full data management life cycle. Learn more about HSDS and The HDF Group’s related services. |
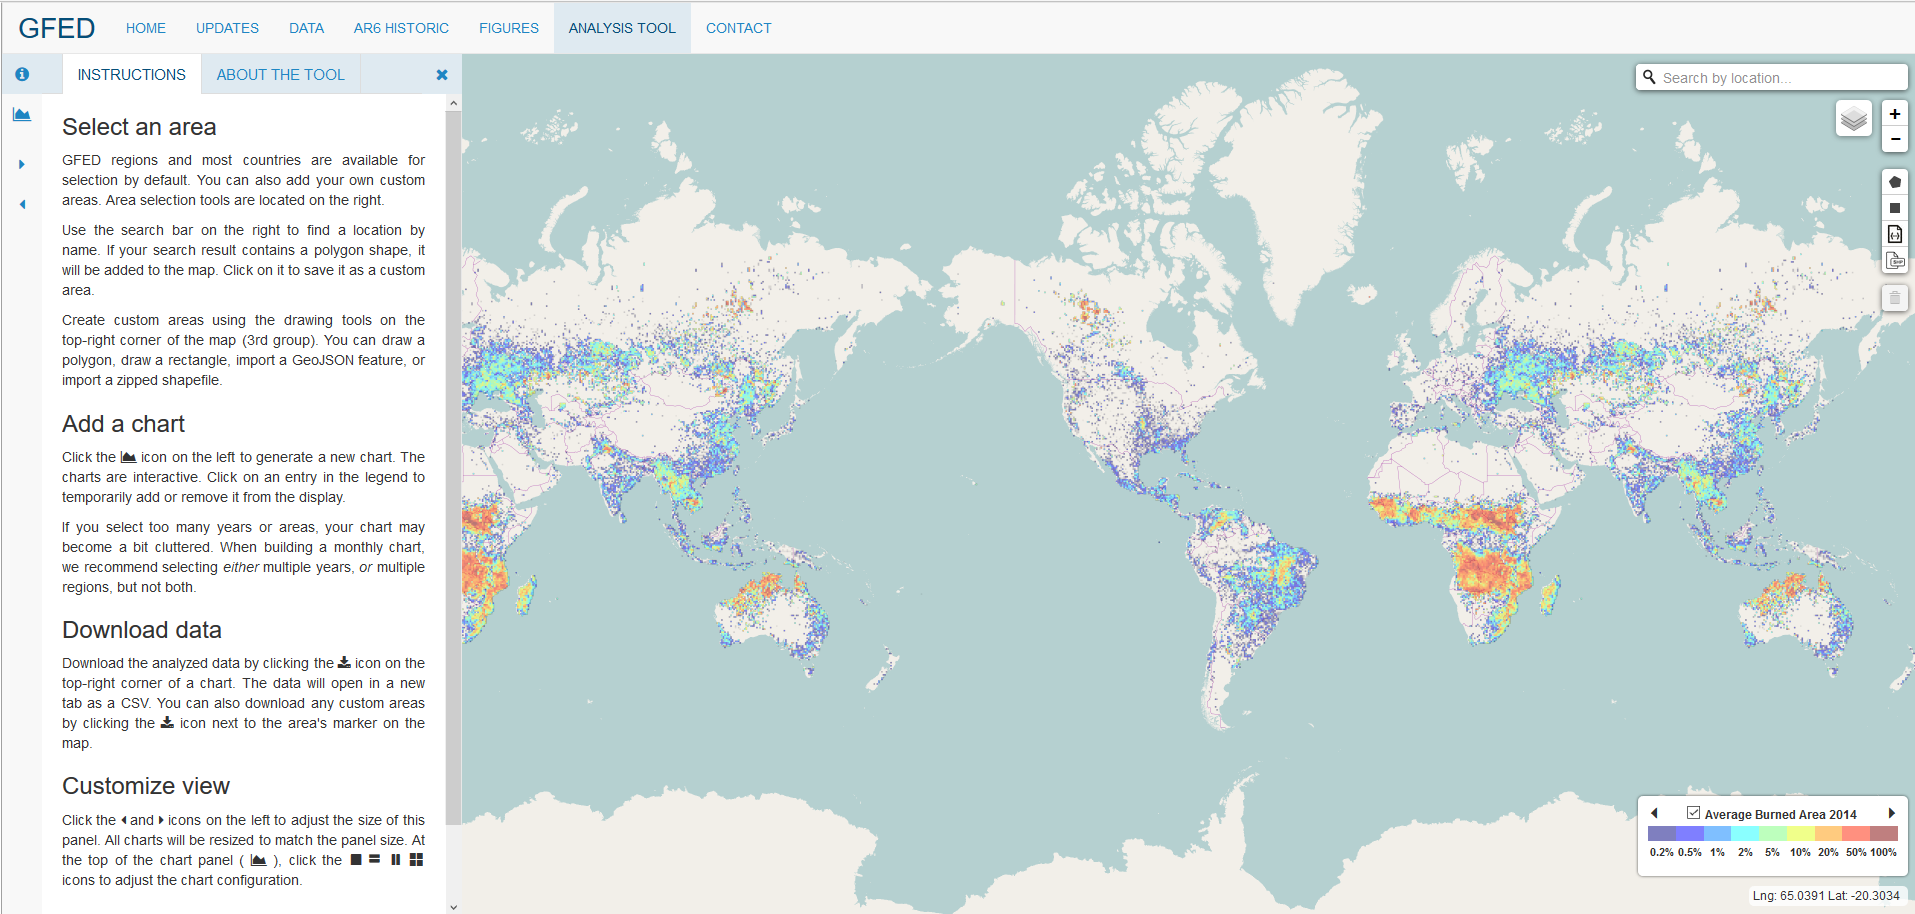
The HDF Server allows producers of complex datasets to share their results with a wide audience base. We used the HDF Server to develop the Global Fire Emissions Database (GFED) Analysis Tool, a website which guides the user through our dataset. A simple webmap interface allows users to select an area of interest and produce data visualization charts.
Several times each year, NASA scientist Doug Morton fields calls from curious news reporters. They want to know more about fire. Dr. Morton is part of a team of scientists from NASA, UC-Irvine, and VU University Amsterdam that has been producing and maintaining a record of global fire detections, burned area, and estimates of carbon emissions and their sources from 1997 to the present. The data are stored as HDF5 files, and are publicly available as part of the Global Fire Emissions Database (GFED).
 Unfortunately, for those with no knowledge of programming, the data are essentially locked away in their HDF file format. In the past, members of the team would take the time to create a data plot for anyone who gave them a call. Now, they are removing the middleman by releasing an on-line data analysis tool.
I was fortunate to have started on this project in January 2016, since The HDF Group had just released the HDF Server, a tool which turned a difficult problem into a relatively simple one. The HDF Server provides a straightforward method for accessing HDF5 data, freeing up the web developer to focus on user interface and design.
Before reading more about its development, I suggest you visit the GFED Analysis Tool and try it out yourself. Use the site to select your own area of interest by drawing it on the map or by using the search bar, and generate one of several charts for your choice of data source, year range, timescale, and display. The image below shows the results of one such analysis.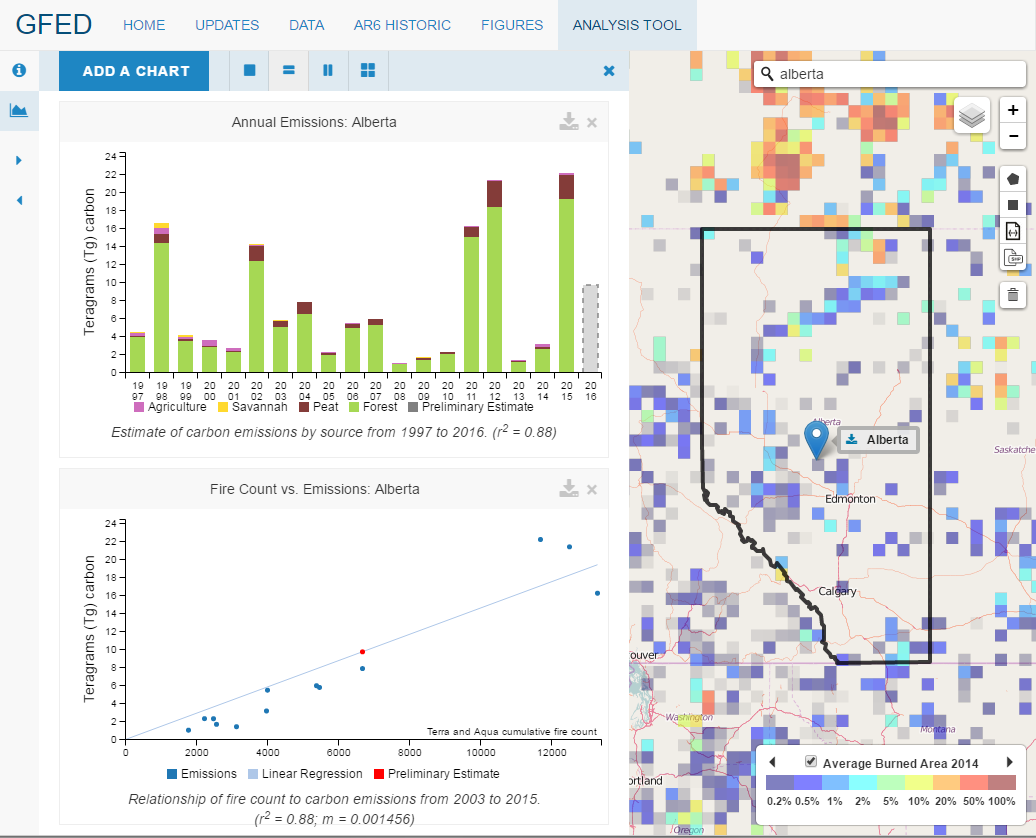
The Development Process
Installing the HDF Server is easy. I followed the on-line instructions, and had a local instance of the server running in less than 15 minutes. After familiarizing myself with the API via the developer documentation, I was ready to get started. This blog post gives a good introduction to using the HDF Server.
The GFED Analysis tool is built in JavaScript, along with some Python maintenance scripts. The JavaScript mapping library Leaflet.js forms the basis of the user area selection. Data visualizations are made using C3.js.
Gathering Dataset UUIDs
The HDF Server assigns each dataset a universally unique identifier (UUID) that can be combined with the file name to access it. In order to avoid multiple REST calls required to explore a file on the server and discover a dataset’s UUID, I wrote a Python script to gather all UUIDs of interest and store them in a JavasScript ID file. Examples of navigating the HDF Server are available in the included integration test folder, and /test/integ/helper.py contains many helpful methods for this such as helper.getUUIDByPath().
Data Selection
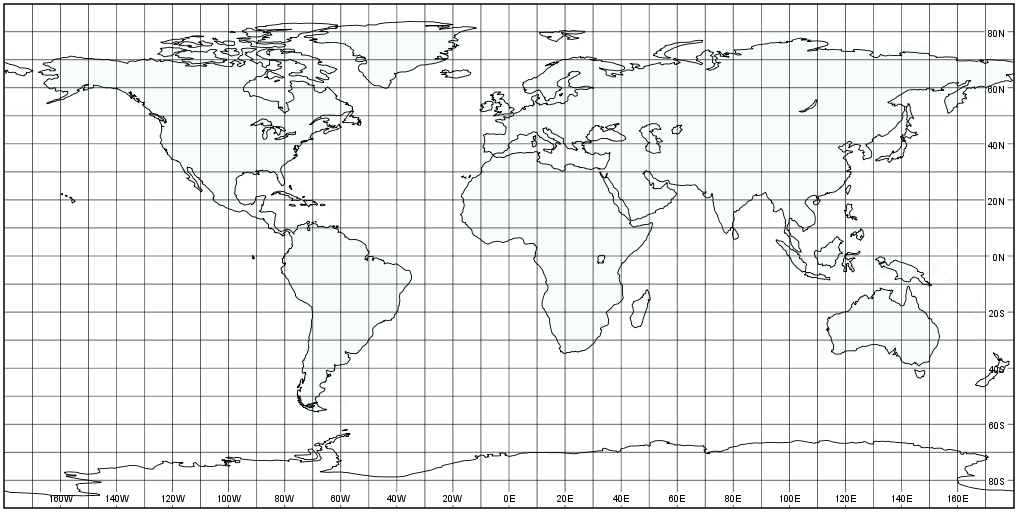
The GFED data consist of several thousand datasets, each in a 1440 x 720 matrix. A user’s polygon selection on the map, which consists of latitude/longitude coordinates, must first be converted into grid coordinates in order to ensure the proper region is selected. I wrote a public gridCoordinates conversion utility for this.
The HDF Server allows selection via a hyperslab, or through a set of points. After testing both methods, I found that the server responded much faster to a hyperslab selection over a bounding box of the user’s area of interest, rather than requesting only the individual points (often several hundred) that comprised their selection.
Subsetting the returned data to include only those points inside of the user’s selection is too complex to describe here, but it relies on determining which grid points lie inside the shape of interest, and then mapping these to match those returned by the HDF Server, which will no longer be zero-aligned due to the hyperslab selection. The article “Line drawing on a grid” from Red Blob Games provides a great walk-through for determining the grid-aligned perimeter of a shape.
Promises for Asynchronous Data Requests
Each chart created relies on many calls to the HDF Server. In order to ensure all data requests have been fulfilled before attempting to create a chart, I used the JavaScript built-in Promise object. The code below demonstrates collecting an array of Promises, which can be resolved upon completion of all requests.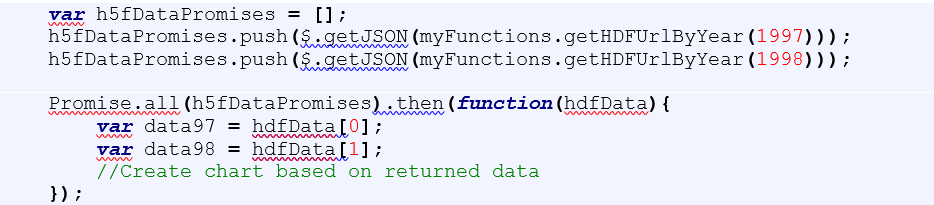
Daily file updates – Secure POST using authentication
Since the HDF Server allows users to POST to a data file, it was important to secure any files to Read-Only mode before making them available on-line. One exception to this was the “Fire Count” dataset, which is updated daily to keep an ongoing record of global fire counts. The HDF Server Admin Tools lets you restrict POST access to a privileged user account.
Concluding Remarks
The GFED Analysis Tool demonstrates how the HDF Server can be used to expand the audience for any HDF dataset. We combined it with existing JavaScript libraries, and were able to create a user interface that eliminates the computer-programming barrier of entry for HDF data.
I’m also happy to answer any additional questions by e-mail at anika.halota at nasa.gov.
Editor’s Notes: Anika Halota has a bachelor’s degree in Computer Science, and a master’s degree in Geography, both from the University of Maryland, College Park. She has been creating on-line data sharing and visualization tools for NASA’s Biospheric Sciences Laboratory since 2015.
The HDF Server project* was funded under the NASA Science Mission Directorate
Research Opportunities in Space and Earth Sciences – 2015, NNH15ZDA001N-ACCESS
A.36 The Advancing Collaborative Connections for Earth System Science (ACCESS) Program solicits projects to leverage existing technologies that enhance and improve data and information systems in support of NASA’s Earth science research goals. The 2015 ACCESS announcement specifically sought technologies that improve data discovery, accessibility and usability for users of NASA’s Earth science data systems, emphasizing interoperability and harmonized user experience.
References:
Global Fire Emissions Database (GFED): http://www.globalfiredata.org
GFED Analysis Tool: http://www.globalfiredata.org/analysis.html
NASA Earth Observatory: https://earthobservatory.nasa.gov/IOTD/view.php?id=88308
Amazon Fire Forecast: https://www.ess.uci.edu/~amazonfirerisk/ForecastWeb/SAMFSS2016.html
* John Readey/The HDF Group Project Manager
Object Store-Based Data Service for Earth System Science, 15-ACCESS15-0031
“Cloud computing offers key benefits of scalability, cost, and redundancy compared with traditional data centers. However most of the tools and software systems developed for NASA data repositories were not developed with the cloud in mind and do not fully take advantage of cloud-based technologies. To address this, we propose the development of a web service (Highly Scalable Data Service or HSDS) that will use object storage rather than file-based storage to vend earth science data. Object storage services are provided through all the leading public (Amazon AWS, Microsoft Azure, Google Cloud, etc.) and private clouds (Open Stack), and provide the most cost-effective means of storing large data collections online. In addition to being cost-effective, the service will be highly scalable in that it will be able to support an effectively unlimited number of clients at high throughput. To enable compatibility with existing tools and applications, we will create client libraries that are API compatible with existing libraries for HDF5 and NetCDF4. We will demonstrate the capabilities of this service by setting up a platform on Amazon AWS that integrates the service with existing NEX/OpenNEX datasets and tools.”