| The group at BioSimulations.org has been doing some very interesting work using HSDS on Kubernetes to store biomodelling data and visualizing the results using Vega as described in the paper below. Biosimulations chose to use HSDS due to its support for very large data sets, REST API (for use with web applications), and its ability to run on Google Cloud as well as on-premise installations. If you have questions on how your organization could similarly take advantage of HSDS’ flexible architecture, feel free to contact The HDF Group. |
A case study of reproducible and reusable data visualizations with HDF5, HSDS, and Vega
By Andrew Freiburger, Bilal Shaikh, and Jonathan Karr
Abstract
To help investigators share, reuse, and combine biological models, we developed BioSimulations, a central repository of biological models, simulations of these models, the results of these simulations, and data visualizations of these results. To enable BioSimulations to support models for a broad range of biological systems and scales, we combined domain formats for models and simulations with HDF5 and HSDS for simulation results and the Vega format for data visualizations. This combination of HDF5, HSDS, and Vega enables interactive figures, closes crucial gaps in the provenance of figures, and opens new possibilities for sharing and reusing visualizations.
Background
Computational models have great potential to accelerate biological science, bioengineering, and precision medicine. For example, models could help engineers design biofactories for drugs and help physicians tailor therapy for each individual’s unique genome. Due to the complexity of biological systems, one promising strategy is to combine multiple submodels of individual systems and scales – e.g. stochastic models for sparse molecules such as RNA and continuous models for abundant molecules such as glucose. This strategy facilitates the collaborative development of large models and enables models to efficiently capture multiple scales. This approach requires that investigators find, combine, and execute models, and visualize and analyze their simulation results. Historically, this has been challenging because different types of models have been siloed by different model languages, simulation algorithms, simulation tools, formats for simulation results, visualizations, and model repositories.
To help investigators discover and simulate models and visualize results of their simulations, we recently developed BioSimulations, a central repository for biological models, their simulation results, and data visualizations of these results. Currently, BioSimulations supports 10 model languages, 21 simulation tools, more than 60 simulation algorithms, and a broad range of data visualizations, including basic charts such as time series plots and histograms, as well as domain-specific diagrams, such as activity flow diagrams, process description maps, and reaction flux diagrams.
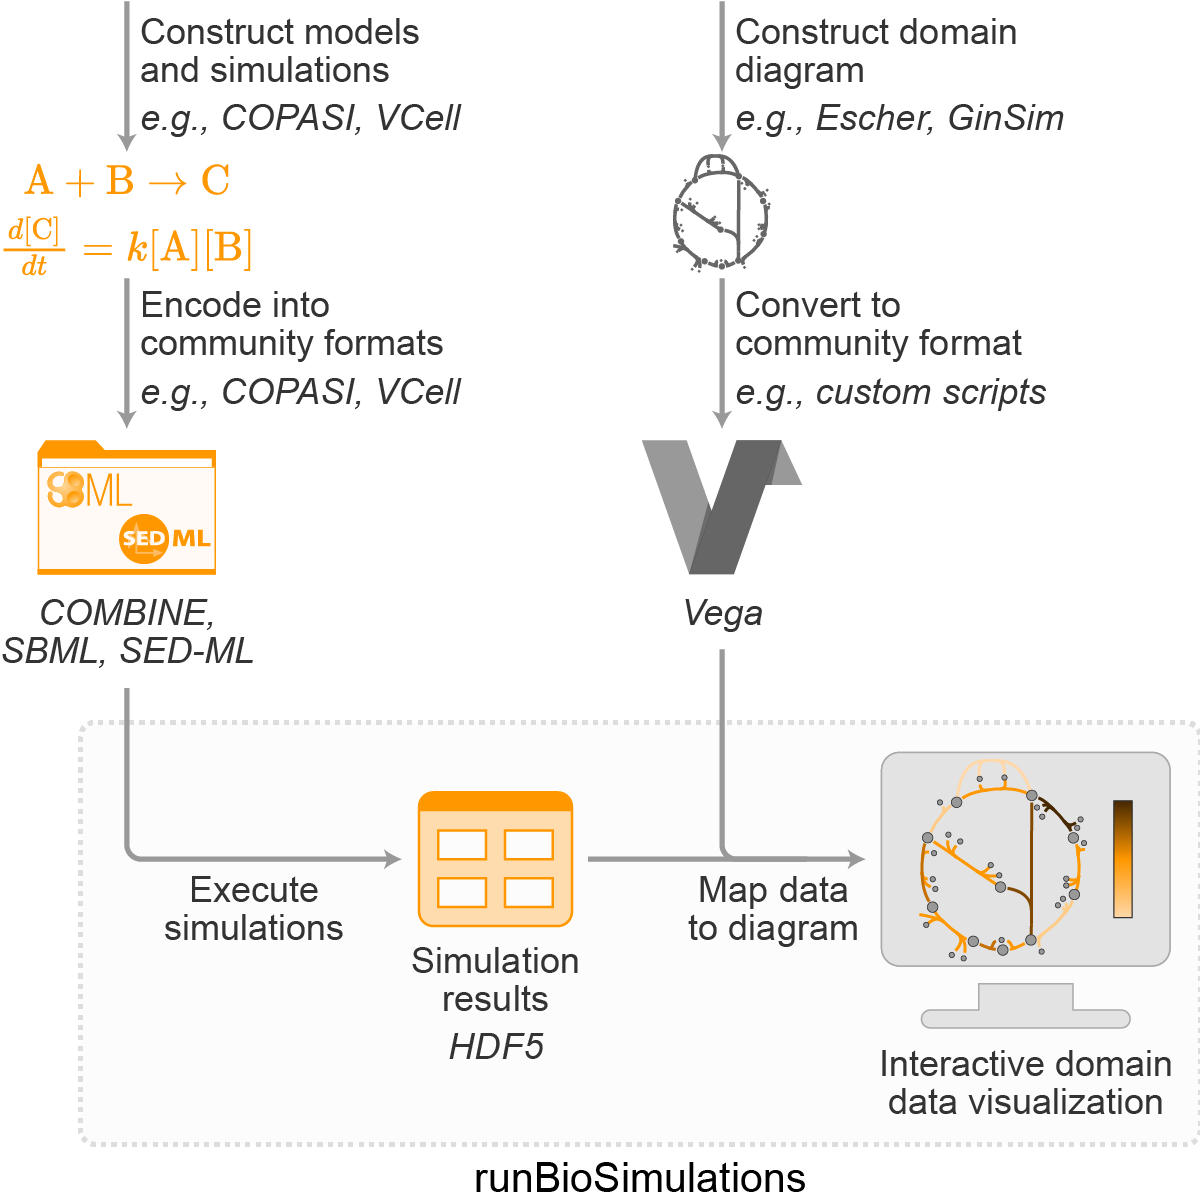 Figure 1. Overview of BioSimulations’ architecture for storing, retrieving, and visualizing the results of simulations of COMBINE archives.
As outlined in Figures 1 and 2, BioSimulations is primarily implemented using domain formats for models and simulations (COMBINE archive format, EDAM, KiSAO, SBO, SED-ML), HDF5 for results of simulations (h5pyd, HSDS), Vega for data visualizations of simulation results, and standard web development tools (Angular, conexion, Flask, MongoDB, NestJS, S3-compatible storage). BioSimulations uses these domain formats to capture simulations of a broad range of models and identify which models should be simulated, which algorithms should be used to simulate the models, and which predictions should be exported to visualize the results of the simulations. To make it easier for investigators to utilize simulation results, we used HDF5 to develop a schema for capturing simulation results and relevant metadata and connected this schema with several of the most popular biological simulation programs. This provides a single format for investigators to interpret the simulation results of numerous models. To make it easier for investigators to access simulation results, we used HSDS to develop an API for storing and retrieving simulation results. This provides investigators a single API for accessing the results of a broad range of simulations. Furthermore, we used this API and the Vega data visualization tool to develop a graphical interface for visualizing simulation results. As part of this, we developed a convention for describing the simulation results with which Vega visualizations should be rendered and a module for rendering such annotated visualizations. Together, this architecture makes it easy for investigators to visualize simulation results from a broad range of models through a variety of diagrams. BioSimulations is deployed using Google Cloud, Mongo Atlas, and HPC at the University of Connecticut School of Medicine.
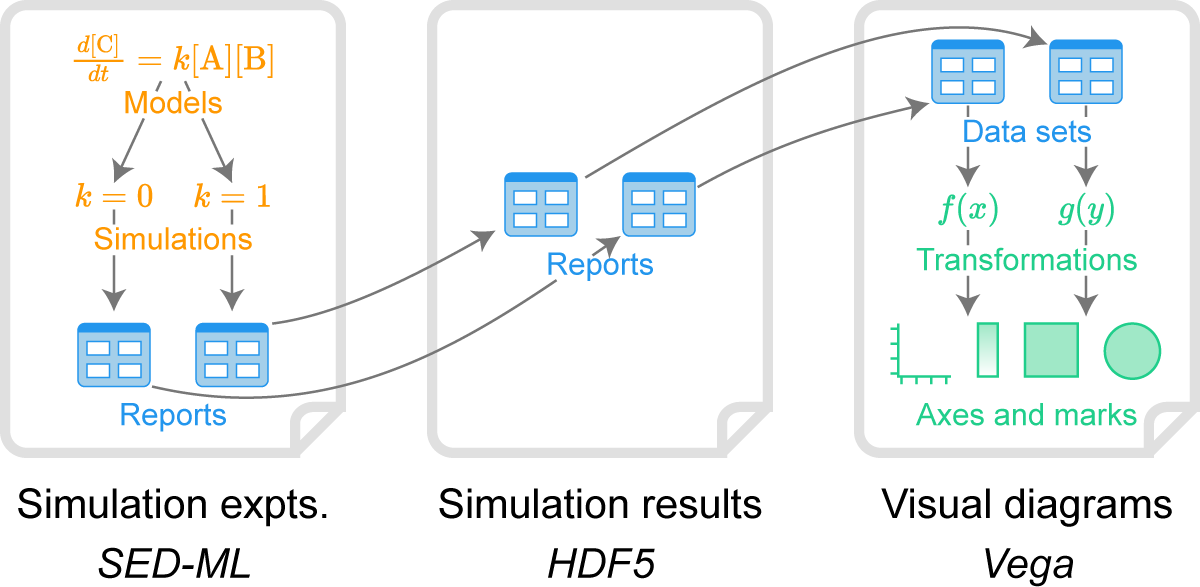 Figure 2. Overview of how BioSimulations uses HDF5 and HSDS to link the results of simulation experiments to data visualizations.
Systemizing the representation of simulation results with HDF5
Historically, biological simulation tools have exported results in a variety of formats such as CSV, HDF5, SBRML, TSV, and XLSX. This array of formats generates friction to the analysis and visualization of simulation results. For example, this array of formats makes it hard to reuse visualization tools with multiple simulation tools. Furthermore, biological simulation tools often export simulation results with insufficient metadata about their meaning and provenance, in part because formats such as CSV and TSV provide minimal support for metadata.
To make it easier for investigators to work with simulation results from a broader range of models, we developed a single schema for capturing the results of any biological simulation. We chose HDF5 to develop this schema for multiple reasons: (a) HDF5’s hierarchical design and support for multidimensional arrays can store groups of related simulation results, such as the results from an ensemble of Monte-Carlo simulations or the results from a batch of simulations that scan across the value of a parameter; (b) HDF5’s support for attributes can capture metadata about simulation results, such as semantic identifiers, labels, and units for each dimension and each element of each dimension; (c) HDF5 enables us to both store simulation results efficiently and efficiently retrieve subsets of simulation results; and finally (d) libraries for HDF5 are available for many of the most popular programming languages including C, Java, MATLAB, and Python.
Our schema (Table 1) uses a single HDF5 file to capture the results of a single simulation experiment (a COMBINE archive which contains one or more simulations of one or more models). Within HDF5 files, groups of related simulations (a SED-ML file) are saved to separate HDF5 groups, wherein the results of individual simulations (a SED-ML report of a simulation task) are typically saved to separate HDF5 data sets. Within these data sets, the predictions of individual simulation variables (a SED-ML data set of a data generator) are saved to individual rows. Metadata, such as semantic labels for each row, are saved to HDF5 attributes for their parent data sets.
Table 1: Schema for encoding the results of simulations (SED-ML files in COMBINE archives) into HDF5.
| Domain concept | HDF5 concept |
| Simulation results of a COMBINE archive (zip archive that contains one or more SED-ML files, which each describe one or more simulations of one or more models in formats such as CellML, SBML) | File |
| Simulation results of a SED-ML file within a COMBINE archive, which typically represents a group of related simulations. | Group |
| Simulation results of a SED-ML report within a SED-ML file, which typically represents the results of a single simulation. | Data set |
| Simulation results of a SED-ML data set within a SED-ML report, which typically represents the predictions of a single variable for a single simulation, such as the predicted trajectory of the concentration of a molecule. | Row of a data set |
| Metadata about the semantic meaning and provenance of a SED-ML data set, such as a semantic label for each row. | Attribute of a data set |
Systemizing the storage and retrieval of simulation results with HSDS
Despite several repositories for sharing models such as BiGG, BioModels, and the Physiome Model Repository, as well as broad data repositories such as FigShare and Zenodo, it has remained difficult to share simulation results. To make it easier for investigators to share and access simulation results, we developed a central repository of simulation results. We implemented this repository through HSDS for several reasons: (a) HSDS is natively compatible with HDF5, which is the format that we use to capture simulation results; (b) HSDS provides a REST API, which is conducive to a graphical web application for running simulations and interactively exploring their results; (c) HSDS scales to very large data sets, which is advantageous for large results such as those from whole-cell models; and finally (d) HSDS can be deployed through Google Cloud, which we aimed to use to deploy BioSimulations.
To ensure that users can reproduce simulation results, BioSimulations performs all simulations using BioSimulators, a set of standardized interfaces for numerous simulation tools that we also recently developed. As a result, simulation results can only be submitted by BioSimulations’ simulation service; users cannot directly upload simulation results. This upload method is implemented with h5pyd’s command line tools. To make it easy for developers to retrieve simulation results, we developed a REST API over our HSDS which enables developers to retrieve the simulation results of specific projects using only the BioSimulations id for the project (or the results of a particular simulation within a project using the BioSimulations id for the project and the id of the simulation within the project). This API does not require users to have any knowledge of HSDS or of how we chose to encode simulation results into HSDS. The API returns results in a JSON-like format (JSON plus NaN and Inf similar to JSON5) that is ideal for web applications, such as BioSimulations.
Systemizing the visualization of the simulation results with Vega
One of the goals of BioSimulations is to enable researchers to investigate the modeling that produced figures in journal articles. For example, to thoroughly review scientific reports, peer reviewers should be able to interactively explore figures, including inspecting other simulation predictions or simulating alternative conditions. We believe that this requires a framework that can capture basic charts, such as histograms and line series charts, as well as complex domain-specific diagrams such as reaction flux maps for visualizing the fluxes of metabolic networks.
One of the most promising solutions for capturing a broad range of charts is Vega, a declarative grammar for interactive data visualizations. The first step to create a Vega visualization is to define the coordinates and style of each visual mark (e.g., node or/and edge of a network diagram), as well as interactivity of each mark such as tooltips. To leverage existing drawing tools for models, we developed Python scripts for converting the outputs of several tools (Escher, GINsim, and SBGN editors such as Newt) into collections of Vega visual marks. We used the Vega editor to preview the results of our scripts and troubleshoot our scripts. This strategy can be applied to additional visualization formats. Additional tools are available for creating Vega diagrams, including the Altair Python library and the Lyra visual editor.
The second step to create a Vega visualization is to encode data into the visualization by brushing visual marks with data, such as positioning, coloring, or sizing shapes and lines based on corresponding data. Data can be loaded into Vega visualizations in one of two ways: (a) data can be hard-coded into the Vega file or (b) data can be loaded from an external URL. Once a simulation has been executed, investigators can use the later method by embedding endpoints for our data API (which wraps HSDS) into Vega visualizations. This requires the BioSimulations identifier for the simulation, which isn’t available until the simulation has been submitted to BioSimulations. To enable authors to submit visualizations together with simulations to BioSimulations, we need to develop a way to describe how visualizations should be rendered with the results of simulations before they are submitted to BioSimulations. We solved this by developing annotations for indicating the simulation results (ids of the SED-ML reports) a Vega visualization should be rendered with and a program for replacing those annotations with concrete hyperlinks to our data API once the results of the simulation are available.
From a user’s perspective, the workflow to render a visualization is as follows: (1) the user uploads a COMBINE archive with SED-ML and Vega files to BioSimulations; (2) BioSimulations executes the SED-ML files and saves their results to our HSDS; (3) the user navigates to the BioSimulations UI to visualize the results of their COMBINE archive; (4) the user selects a Vega file to render, (5) the BioSimulations UI retrieves the Vega file; (6) the UI identifies the data annotations in the Vega files and replaces them with concrete hyperlinks to our API for the HSDS; (7) the UI uses Vega-Embed to render the concretized visualization; (8) the user interactively explores the rendered visualization, and (9) the user exports the rendered visualization to SVG for publication.
Figure 3 illustrates a visualization of the results of a COMBINE archive that describes three simulations of three genetic variants of a cell cycle regulatory circuit of Saccharomyces cerevisiae. Several additional examples are available at BioSimulations.
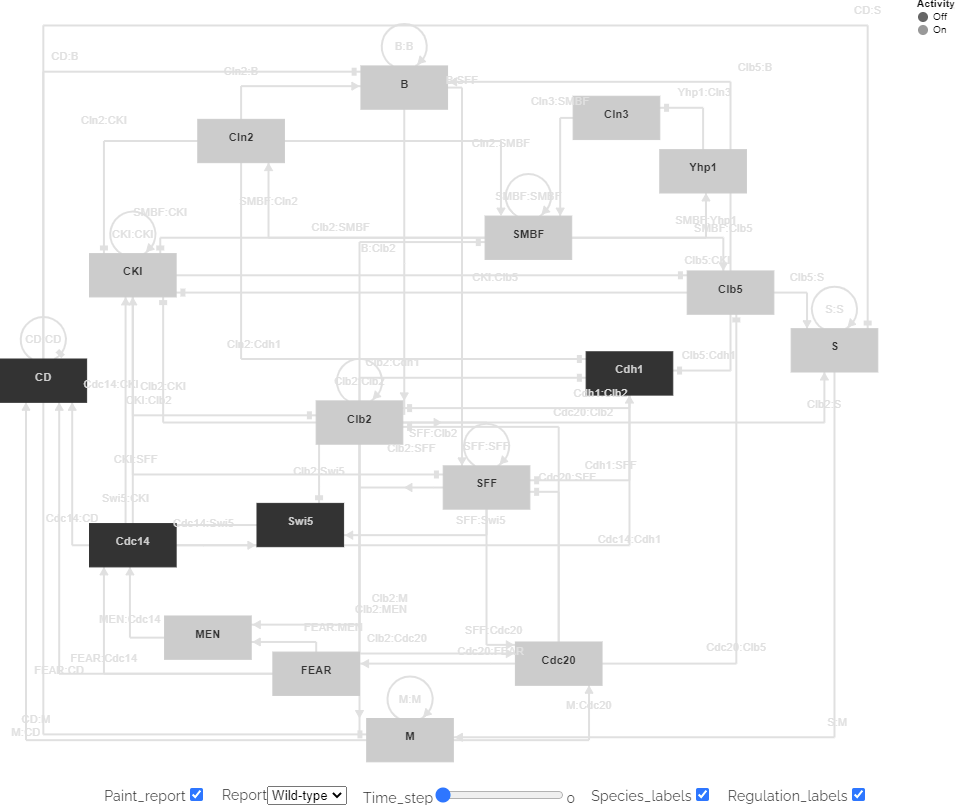 Figure 3. Vega visualization of the predicted dynamics of the cell cycle regulatory circuit of Saccharomyces cerevisiae rendered with simulation results retrieved from an HSDS. An interactive version of the figure is available at https://biosimulations.org/projects/Yeast-cell-cycle-Irons-J-Theor-Biol-2009.
The ability to load simulation data into Vega files through external URLs facilitates the reuse of visualizations by making it easy to render visualizations with the results of multiple simulations on a single network structure. For example, the same diagrammatic structure can be used to visualize the results of simulations of multiple conditions of a single model, multiple simulations of a model with different algorithms or tools, or similar simulations with different modeling formalisms.
Conclusion
BioSimulations provides a central place for investigators to share, discover, execute, and visualize biological simulations across models for a wide range of biological systems and scales. Key aspects of BioSimulations were enabled by using HDF5 to capture simulation results, by using HSDS to efficiently store and retrieve simulation results, and by combining HSDS with Vega to visualize simulation results. This combination of HDF5, HSDS, and Vega automatically captures the provenance of data visualizations, enables investigators to interactively explore simulation results, and opens powerful new possibilities for sharing and reusing visualizations.
Getting involved
We welcome contributions to BioSimulations! Potential contributors are invited to attend our weekly meetings or contact the lead developers for help getting started.
Acknowledgements
BioSimulations was developed in collaboration with Ion Moraru, Michael Blinov, Herbert Sauro, Lucian Smith, David Nickerson, John Gennari and numerous additional investigators. BioSimulations was developed with support from NIH award P41EB023912.
More information
Home page: https://biosimulations.org
API: https://api.biosimulations.org
Documentation: https://docs.biosimulations.org/
Discussion forum: https://github.com/biosimulations/biosimulations/discussions
Issue tracker: https://github.com/biosimulations/biosimulations/issues
Source code: https://github.com/biosimulations/biosimulations