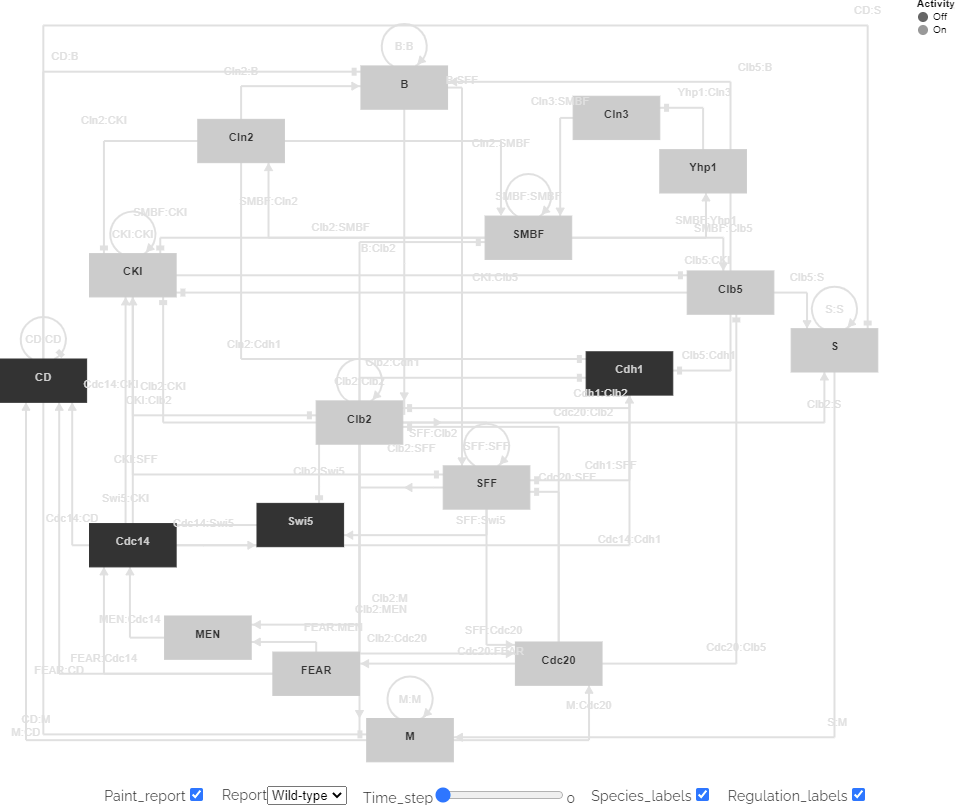
Figure 3. Vega visualization of the predicted dynamics of the cell cycle regulatory circuit of Saccharomyces cerevisiae rendered with simulation results retrieved from an HSDS
Figure 3. Vega visualization of the predicted dynamics of the cell cycle regulatory circuit of Saccharomyces cerevisiae rendered with simulation results retrieved from an HSDS